Showing posts with label visual thinking. Show all posts

Monday, 7 October 2013

Visual Thinking: Questionaire's/Quiz's


My idea is using web interactive as a new platform for communicating narratives. I have looked at websites that use slideshow based design. The information is structured in a chronological/methodical sequence. This order allows the development of the idea/message to be communicated effectively.


I thought it be good to tailor information to the users input to address a narrative that is appropriate to them. 

One way to do this are Quiz’s that tally up your answers, e.g. A, B or C. The most chosen answer provides a answer specific your chosen A, B or C.

I could use these structures to deliver information based on the users input. The purpose of this could be to persuade them about a ethical issue for example. If they choose the wrong answer, you could provide an option for them to view the answer if they had chosen the correct one.

Examples include

NHS Alcohol calculator 


Asks multiple choice questions to the user to evaluate if your having too much alcohol. The information provided depends on what score you get. This comes under self help guide. The purpose is to inform the user. 

Zodiac Questionnaire 


Questions to determine what Zodiac sign you are. There is some kind of system that adds up your answers and determines what personality that you match the most. 


Visual Thinking: Flowcharts


I think flowcharts will be good to look at because of how it impacts the user.

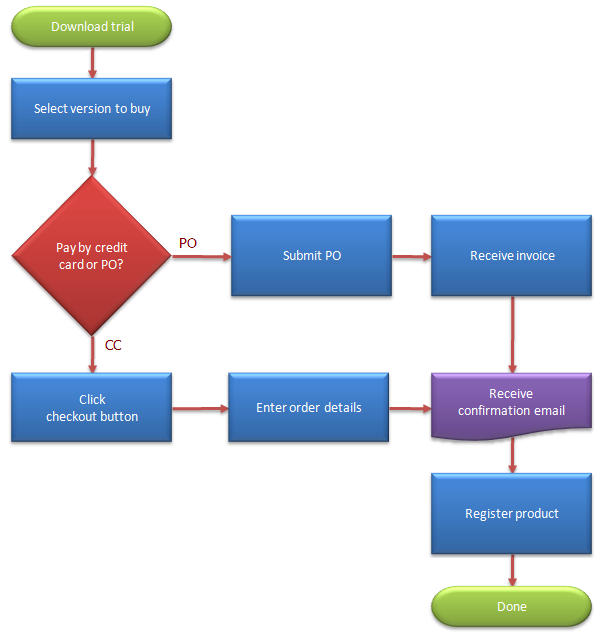
It follows a process, your answers determine which pathway you take. Yes or No can be used. The wrong answers can lead you to consequence or different course of action. Flow charts construct a narrative.

Ideas for my own narrative could be complex processes like: how to sign up for getting a visa. The narrative could address, what obstacles are involved. What are the different methods to obtain it? What is the best way to get citizenship? The narrative could have an agenda, such as to argue how impractical a system is, and how there should be better reform to make it better. You can back up your argument with information.
Siutational things work best, when there are different criteria that will determine if your eligible for something, e,g. housing benefits.


The amount of UCAS points you get and the average amount for the top tier, middle tier, lower tier universities (require data). Simulate the best possible choices for you depending on your expected grades. I think this will work if there is a database or something behind it to retrieve the right information, the focus will be, how to visualise this information in a creative way?